@cjerrington you should do a heatmap of each letter at each position
Wordle Analytics
13 Jun, 2023
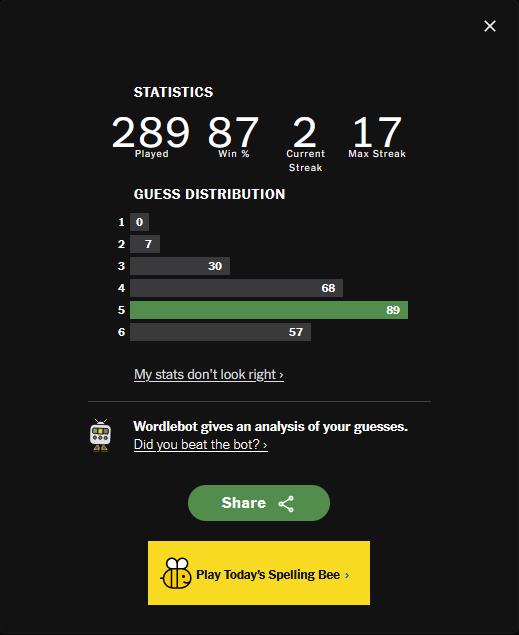
I have been playing the Wordle for 289 times according to the stats the game gives you along with your guess distribution. The Wordle is a game from the NY Times. This is a game I share with some people and also post to my social media as well as a way to compare and compete in a way with friends, family, and others around you.
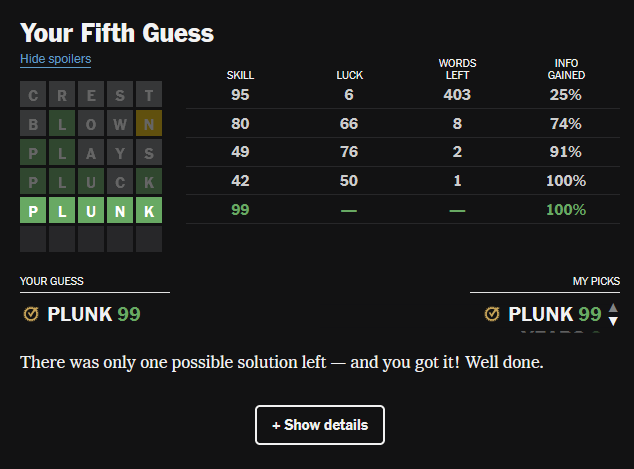
Recently I found the Wordle not only provides your guess distribution, but shows you if you could be the bot. This goes through a random sample of words and the guess distirbution of your guesses until you reach the final answer and how close you might be to others to get the "fastest" solution. Having this kind of result if fun when we have hard words and seeing how one guess leads you to the solution, and possible words to reach that goal.
What I was interested in was the letter distribution over the month, then talley it up at the end of the month and year. I choose to use Python to help work with the kind of data sample I have. I was able to find a few sites that keep track of the previous answers for a historical reference probably for friends and family to recall what the word was since it refreshes each day.
The idea also came from watching an episode of Wheel of Fortune when you have a word or phase to guess. They also use the R,S,T,L,N,E and a vowel as the common letters for the final phase as those are the common letters as well.
So how does the Wordle stack up with this?
For the month of May, 21 letters used of the alphabet
| Letter | Percentage |
|---|---|
| A | 9.68% |
| B | 2.58% |
| C | 5.16% |
| D | 1.29% |
| E | 10.97% |
| F | 1.94% |
| G | 5.81% |
| H | 3.23% |
| I | 4.52% |
| K | 4.52% |
| L | 7.74% |
| M | 2.58% |
| N | 5.81% |
| O | 8.39% |
| P | 2.58% |
| R | 7.74% |
| S | 5.81% |
| T | 3.23% |
| U | 3.23% |
| W | 1.94% |
| Y | 1.29% |
I thought sorting the results by the order of the alphabet would be the most appropriate when figuring out which letters might not be used. How does this get calculated? Python has a collections module and from there the data processing begins.
def main(wordledate):
  # the main function to process the words used in the wordle by date files

  # Define a filename and month given from the arguments
  filename = f"{wordledate}_words.txt"

  # read the words into the script
  with open(filename) as file:
      data = file.read().replace('\n','')

  # start our collection and sum up the total number of each time a letter is used
  collection = Counter(data)
  total = sum(collection.values())

  # calculate the date and update based on the leading 0 of the file/month name
  mydate = datetime.strptime(wordledate, "% | m").strftime("% | B")
  print(f"For the month of {mydate}, {len(collection)} letters used of the alphabet")

  # Loop over the items in the collection and calculate the percent
  for letter, count in sorted(collection.items()):
      percent = percentage(count, total)
      print(f"{letter} | {percent}% | ")
I was thinking of posting these kinds of results on my website and also online over time. Follow along for more and we'll see how this changes from month to month!
I'm publishing this as part of 100 Days To Offload. You can join in yourself by visiting 100DaysToOffload.com.
Tags: coding, gaming, python, wordle, 100DaysToOffload
Webmentions
If there are replies, they will show below.
1 Reply
Found an issue? Edit on Github
← Back home